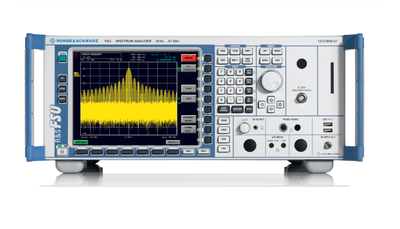
Quick quote: Rohde & Schwarz FSU46 (1166.1660.46)
Rohde & Schwarz FSU46 (1166.1660.46)
Model
FSU46 (1166.1660.46)Product Family
RF & Microwave Spectrum AnalyzersManufacturer
Rohde & SchwarzConfigured models contain the following attributes:
RF & Microwave Spectrum AnalyzersSpectrum Analyzers-Performance20GHz <= 50GHzDC <= 1kHzLet us help you with your exact configuration
Please use 'Get Quick Quote' and we’ll contact you and quote for your exact need.
You can also get in touch, if you prefer, and our experts will be able to guide you with the right application and procurement solution for this product.
Key Specs
| Attribute | Value |
|---|---|
| High Frequency (range) | 20GHz <= 50GHz |
| Low Frequency (range) | DC <= 1kHz |
Product Overview
The FSU is a high-performance spectrum analyzer with outstanding performance in phase noise, dynamic range and measurement accuracy that meets any challenge in RF analysis – in aerospace and defense or for general microwave applications up to 67 GHz.
To handle the wide variety of measurement tasks in product development, an instrument must offer ample functionality and excellent performance in all areas of interest. The FSU fully meets these requirements.
Its wide dynamic range makes the FSU an ideal tool for base station development and testing. That plus the excellent characteristics already incorporated in the standard model, e.g. < 0.3 dB total measurement uncertainty, gated sweep and IF power trigger. Due to its low phase noise and low noise floor, the FSU is the ideal instrument for measurement tasks in RADAR development and when searching for spurious emissions.
A full choice of detectors for adaptation to a wide range of signal types, versatile resolution filters and additional applications make the FSU a multi-purpose easy-to-use measurement tool.
| Key Features |
| Frequency Models- 3.6/8/26/43/46/50/67 GHz |
| TOI > 20 dBm, typ. +25 dBm |
| 1 dB compression: +13 dBm (0 dB RF attenuation) |
| Displayed average noise level: –152 dBm at 2 GHz; |
| –148 dBm at 26 GHz (1 Hz bandwidth) |
| Typ. 77 dB ACLR for 3GPP, typ. 84 dB with noise correction |
| Phase noise: typ. –160 dBc (1 Hz) at 10 MHz carrier offset |
| Noise correction |
| Specifications | ||||
FSU Spectrum Analyzer | ||||
| Model Overview | ||||
| Model | FSU3 | FSU8 | FSU26 | FSU43 |
| Frequency | ||||
| Frequency Range | 20 Hz to 3.6 GHz | 20 Hz to 8 GHz | 20 Hz to 26.5 GHz | 20 Hz to 43 GHz |
| Reference Frequency | aging: 1 x 10 –7/year with FSU-B4 option: 3 x 10 –8/year | aging: 1 x 10 –7/year with FSU-B4 option: 3 x 10 –8/year | aging: 1 x 10 –7/year with FSU-B4 option: 3 x 10 –8/year | aging: 1 x 10 –7/year with FSU-B4 option: 3 x 10 –8/year |
| Spectral Purity | ||||
| Phase Noise | typ. –133 dBc (1 Hz) at 640 MHz in 10 kHz from carrier | typ. –133 dBc (1 Hz) at 640 MHz in 10 kHz from carrier | typ. –133 dBc (1 Hz) at 640 MHz in 10 kHz from carrier | typ. –133 dBc (1 Hz) at 640 MHz in 10 kHz from carrier |
| Sweep Time | ||||
| Span ≥10 Hz | 2.5 ms to 16 000 s | 2.5 ms to 16 000 s | 2.5 ms to 16 000 s | 2.5 ms to 16 000 s |
| Span 0 Hz (zero span) | 1 μs to 16 000 s | 1 μs to 16 000 s | 1 μs to 16 000 s | 1 μs to 16 000 s |
| Resolution Bandwidth | 10 Hz to 50 MHz (FSU43: 10 Hz to 10 MHz) FFT filter: 1 Hz to 30 kHz, channel filter, EMI bandwidth | 10 Hz to 50 MHz (FSU43: 10 Hz to 10 MHz) FFT filter: 1 Hz to 30 kHz, channel filter, EMI bandwidth | 10 Hz to 50 MHz (FSU43: 10 Hz to 10 MHz) FFT filter: 1 Hz to 30 kHz, channel filter, EMI bandwidth | 10 Hz to 50 MHz (FSU43: 10 Hz to 10 MHz) FFT filter: 1 Hz to 30 kHz, channel filter, EMI bandwidth |
| Video Bandwidth | 1 Hz to 10 MHz | 1 Hz to 10 MHz | 1 Hz to 10 MHz | 1 Hz to 10 MHz |
| Display Range | displayed average noise level to +30 dBm | displayed average noise level to +30 dBm | displayed average noise level to +30 dBm | displayed average noise level to +30 dBm |
Displayed Average Noise Level (1 Hz RBW) | ||||
| 1 GHz | typ. –158 dBm | typ. –158 dBm | typ. –156 dBm | typ. –156 dBm |
| 7 GHz | − | typ. –154 dBm | typ. –156 dBm | typ. –153 dBm |
| 13 GHz | − | − | typ. –153 dBm | typ. –153 dBm |
| 26 GHz | − | − | − | typ. –148 dBm |
| 40 GHz | − | − | − | typ. –143 dBm |
Displayed averagenoise level with preamplifier ON (FSU-B25), 1 GHz, 1 Hz RBW | < –162 dBm | < –162 dBm | < –162 dBm | < –162 dBm |
Displayed averagenoise level with preamplifier ON (FSU-B24), 26 GHz, 10 Hz RBW | − | − | typ. –166 dBm | typ. –166 dBm |
| Trace Detectors | Max Peak Min Peak Auto Peak Sample RMS Average Quasi Peak CISPR-AV CISPR-RMS | Max Peak Min Peak Auto Peak Sample RMS Average Quasi Peak CISPR-AV CISPR-RMS | Max Peak Min Peak Auto Peak Sample RMS Average Quasi Peak CISPR-AV CISPR-RMS | Max Peak Min Peak Auto Peak Sample RMS Average Quasi Peak CISPR-AV CISPR-RMS |
| Total Measurement error, f < 3.6 GHz | 0.3 dB | 0.3 dB | 0.3 dB | 0.3 dB |
| Display Linearity | 0.1 dB (0 dB to –70 dB) | 0.1 dB (0 dB to –70 dB) | 0.1 dB (0 dB to –70 dB) | 0.1 dB (0 dB to –70 dB) |
| Specifications | |||
FSU Spectrum Analyzer | |||
| Model Overview | |||
| Model | FSU46 | FSU50 | FSU67 |
| Frequency | |||
| Frequency Range | 20 Hz to 46 GHz | 20 Hz to 50 GHz | 20 Hz to 67 GHz |
| Reference Frequency | aging: 1 x 10 –7/year with FSU-B4 option: 3 x 10 –8/year | aging: 1 x 10 –7/year with FSU-B4 option: 3 x 10 –8/year | aging: 1 x 10 –7/year with FSU-B4 option: 3 x 10 –8/year |
| Spectral Purity | |||
| Phase Noise | typ. –133 dBc (1 Hz) at 640 MHz in 10 kHz from carrier | typ. –133 dBc (1 Hz) at 640 MHz in 10 kHz from carrier | typ. –133 dBc (1 Hz) at 640 MHz in 10 kHz from carrier |
| Sweep Time | |||
| Span ≥ 10 Hz | 2.5 ms to 16 000 s | 2.5 ms to 16 000 s | 2.5 ms to 16 000 s |
| Span 0 Hz (zero span) | 1 μs to 16 000 s | 1 μs to 16 000 s | 1 μs to 16 000 s |
| Resolution Bandwidth | 10 Hz to 50 MHz (FSU43: 10 Hz to 10 MHz) FFT filter: 1 Hz to 30 kHz, channel filter, EMI bandwidth | 10 Hz to 50 MHz (FSU43: 10 Hz to 10 MHz) FFT filter: 1 Hz to 30 kHz, channel filter, EMI bandwidth | 10 Hz to 50 MHz (FSU43: 10 Hz to 10 MHz) FFT filter: 1 Hz to 30 kHz, channel filter, EMI bandwidth |
| Video Bandwidth | 1 Hz to 10 MHz | 1 Hz to 10 MHz | 1 Hz to 10 MHz |
| Display Range | displayed average noise level to +30 dBm | displayed average noise level to +30 dBm | displayed average noise level to +30 dBm |
Displayed Average Noise Level (1 Hz RBW) | |||
| 1 GHz | typ. –156 dBm | typ. –156 dBm | typ. –152 dBm |
| 7 GHz | typ. –153 dBm | typ. –153 dBm | typ. –148 dBm |
| 13 GHz | typ. –153 dBm | typ. –153 dBm | typ. –148 dBm |
| 26 GHz | typ. –148 dBm | typ. –148 dBm | typ. –142 dBm |
| 40 GHz | typ. –143 dBm | typ. –136 dBm | typ. –142 dBm |
| 50 GHz | – | typ. –131 dBm | typ. –140 dBm |
| 60 GHz | – | – | typ. –132 dBm |
Displayed averagenoise level with preamplifier ON (FSU-B25), 1 GHz, 1 Hz RBW | < –162 dBm | < –162 dBm | − |
Displayed averagenoise level with preamplifier ON (FSU-B24), 26 GHz, 10 Hz RBW | typ. –166 dBm | typ. –166 dBm | − |
| Trace Detectors | Max Peak Min Peak Auto Peak Sample RMS Average Quasi Peak CISPR-AV CISPR-RMS | Max Peak Min Peak Auto Peak Sample RMS Average Quasi Peak CISPR-AV CISPR-RMS | Max Peak Min Peak Auto Peak Sample RMS Average Quasi Peak CISPR-AV CISPR-RMS |
| Total Measurement error, f < 3.6 GHz | 0.3 dB | 0.3 dB | 0.3 dB |
| Display Linearity | 0.1 dB (0 dB to –70 dB) | 0.1 dB (0 dB to –70 dB) | 0.1 dB (0 dB to –70 dB) |
| Specifications | ||
| FSU Spectrum Analyzer | ||
| Model Overview | ||
| Model | Order Number | Description |
| FSU3 | 1313.9000.03 | Spectrum Analyzer, 20 Hz to 3.6 GHz |
| FSU8 | 1313.9000.08 | Spectrum Analyzer, 20 Hz to 8 GHz |
| FSU26 | 1313.9000.26 | Spectrum Analyzer, 20 Hz to 26.5 GHz |
| FSU43 | 1313.9000.43 | Spectrum Analyzer, 20 Hz to 43 GHz |
| FSU46 | 1313.9000.46 | Spectrum Analyzer, 20 Hz to 46 GHz |
| FSU50* | 1313.9000.49 | Spectrum Analyzer, 20 Hz to 50 GHz |
| FSU50 | 1313.9000.50 | Spectrum Analyzer, 20 Hz to 50 GHz |
| FSU67* | 1313.9000.66 | Spectrum Analyzer, 20 Hz to 67 GHz |
| FSU67 | 1313.9000.67 | Spectrum Analyzer, 20 Hz to 67 GHz |
Notes:
Accessories Supplied:
Power cable, printed quick start guide and CD-ROM (with operating manual and service manual).
FSU26: Test port adapter with 3.5 mm female (1021.0512.00) and N female (1021.0535.00) connector.
FSU43, FSU46: Test port adapter with 2.92 mm (K) female (1036.4790.00) and N female (1036.4777.00) connector.
FSU50: Test port adapter with 2.4 mm female (1088.1627.02) and N female (1036.4777.00) connector.
* Max. bandwidth 10 MHz.
Can't find what you are looking for?
Get in touch


